Author: Arunkumar Navaneethan
This Tableau experience meeting gave me the opportunity to meet experts from the Tableau Company and other Business Intelligence enthusiast from Phoenix, AZ. My key take away Understanding the user groups must be the...
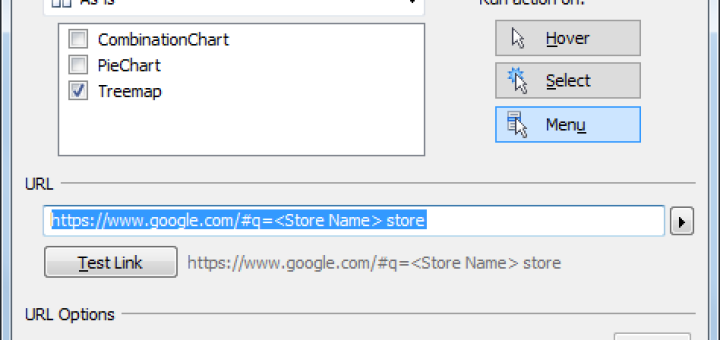
My Use-case We can carry out various external interaction using the URL action. We can use this to redirect users to google search results, intranet sites, REST methods or predefined URLs 1. Google search...
My Use-case They are three different workbooks with data across years. Must link the workbooks together based on user selection of a year using parameters. Steps 1. Create the Year Parameter 2. Drag the...
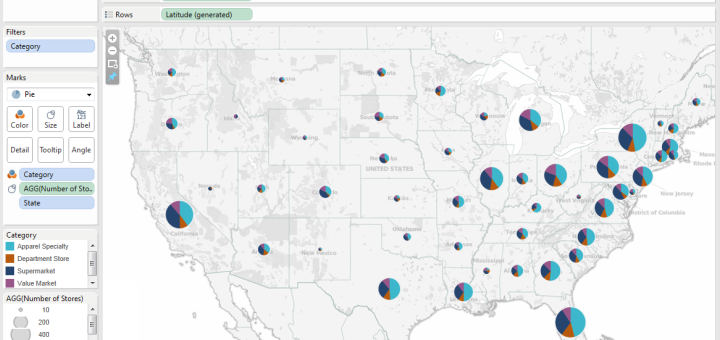
My Use-case Display pie chart over every state, sized by the total number of stores. Size the slices of the pie chart by store categories. This will help us understand which states have more number...
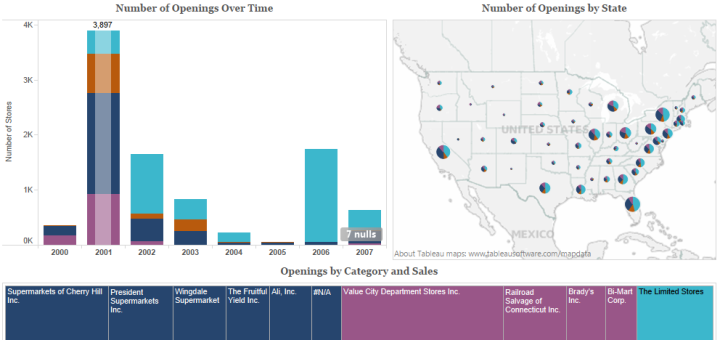
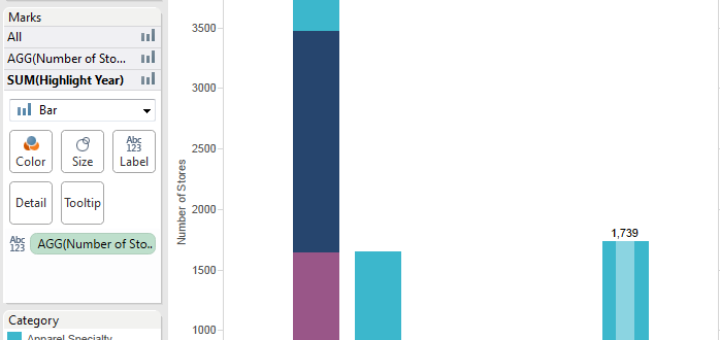
My Use-case To display a chart with Number of stores across years, differentiating each year by category of the store. In addition, have an overlay that would show the total for the given year...
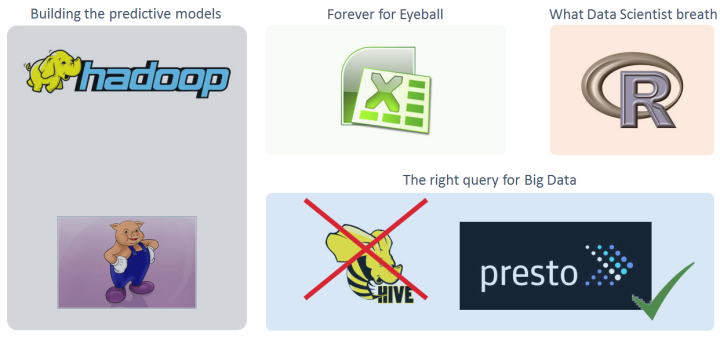
Presenter: Raz Yalov, CTO, 41st parameter This was one of the best, simple and clear presentation on Big data I have attended. The presenter distinguishes big data clearly as a challenge of data of size...
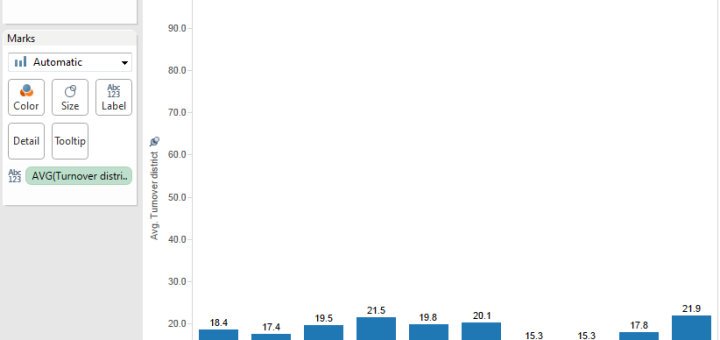
My use case: The underlying data is percentage turnover for different regions. The maximum value was around 21. Tableau default axis length settings is automatic. It created a chart with a range of 0...
My use case: Tableau maps visualization for data from a Single state I have data for teacher turnover in schools within Austin, TX (2004 – 2013). I used the user defined latitude and Longitude...
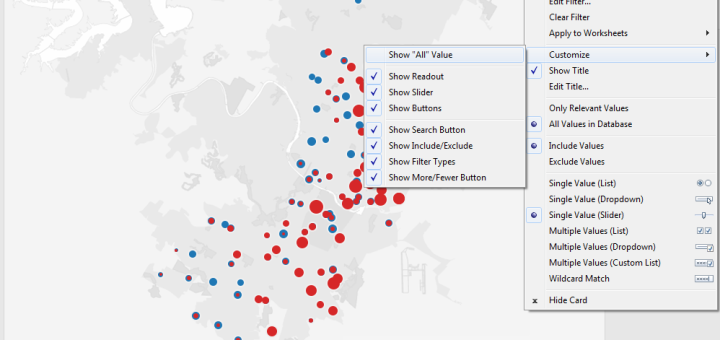
The default filter will start from “All” Change the custom filter settings Filter excluding “All” My Use-Case: When a data-set consist of data across multiple years or multiple categorical separation. The visualization is expected...
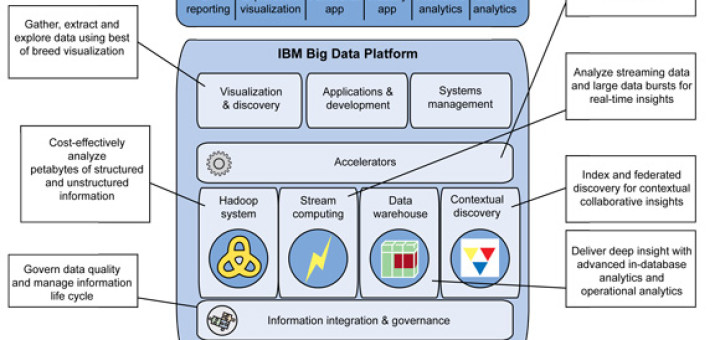
Machine data analytics, Big Data meetup Phoenix, Arizona Feb 26th 2014 An event conducted by IBM for developers. Presented about machine data analytics and their big data product Big Insight. Big insight is...
