Tableau maps background colors
My use case:
Tableau maps visualization for data from a Single state
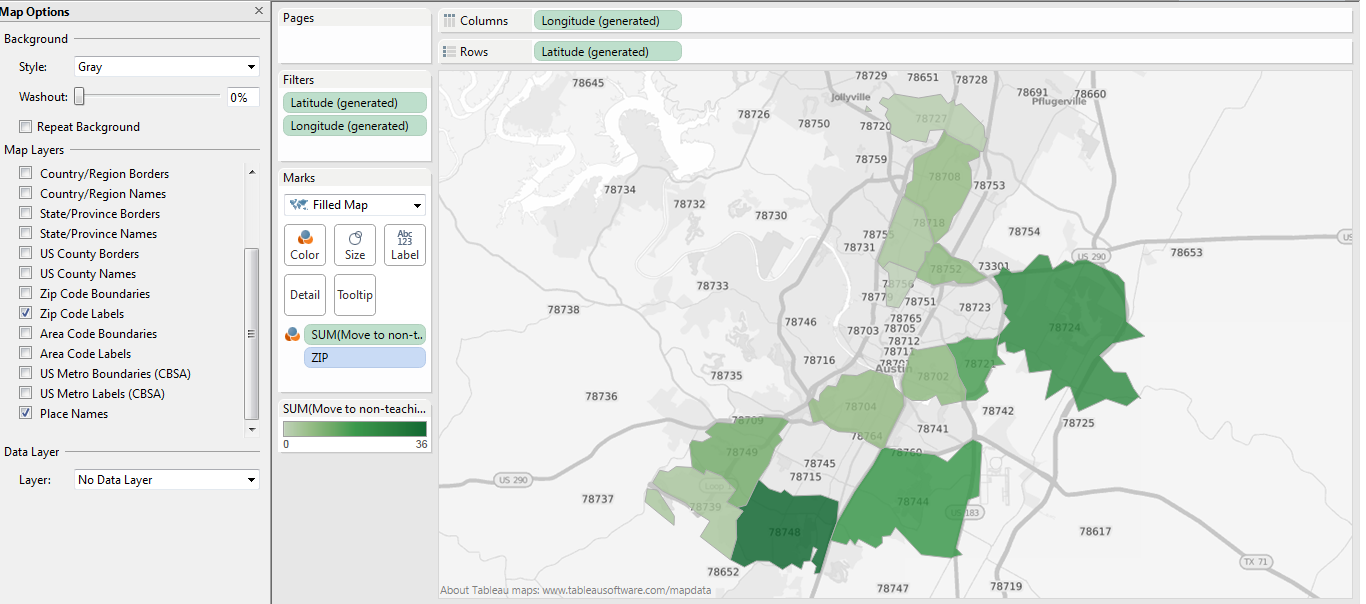
I have data for teacher turnover in schools within Austin, TX (2004 – 2013). I used the user defined latitude and Longitude values, plotting school name as details.

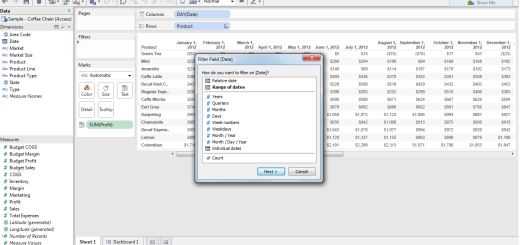
The map can be customized using the “Map Options” which is under “Map” tool bar.
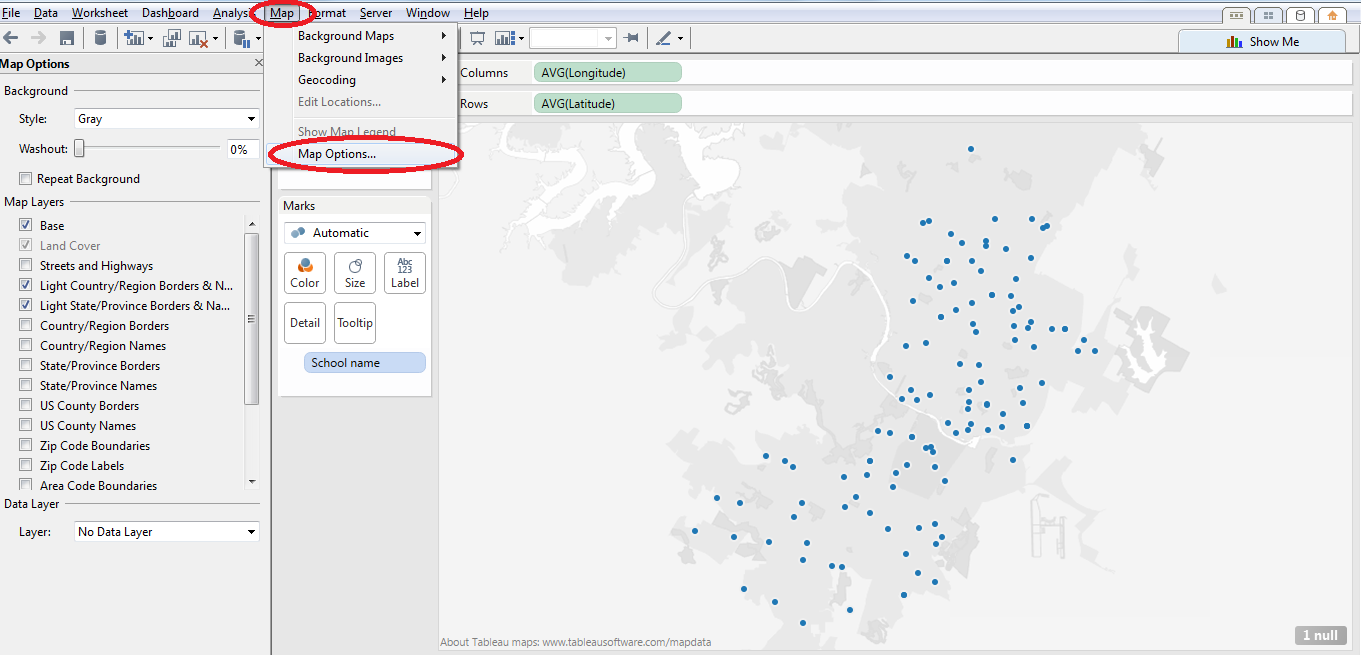
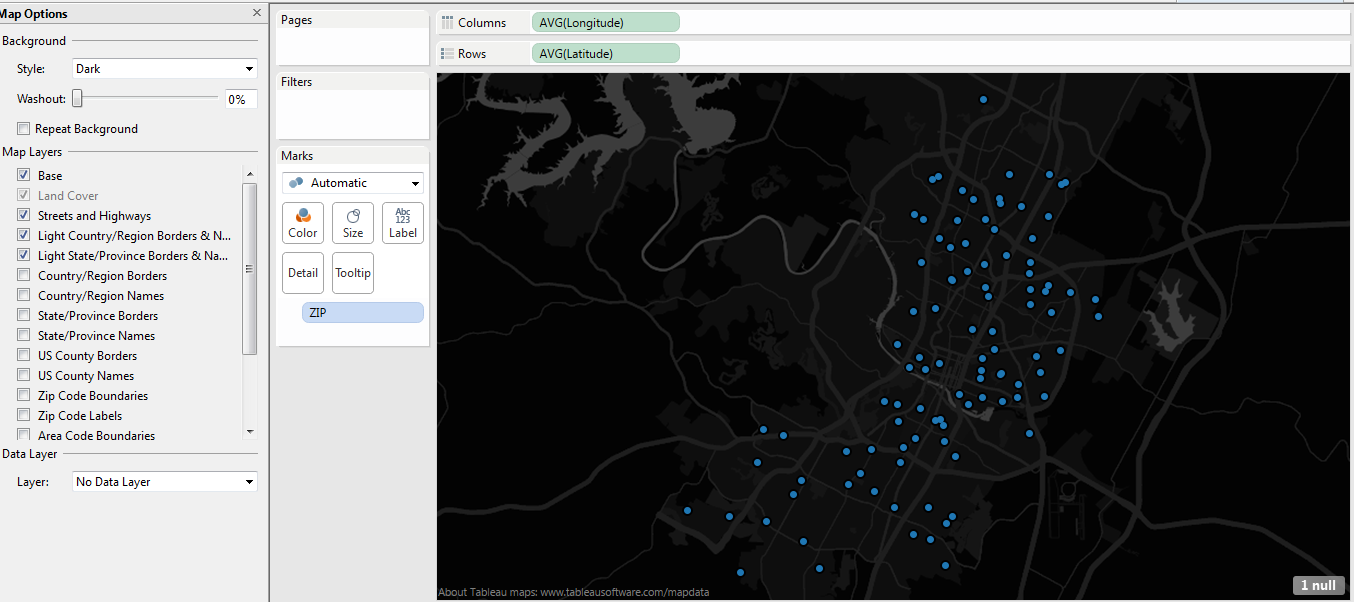
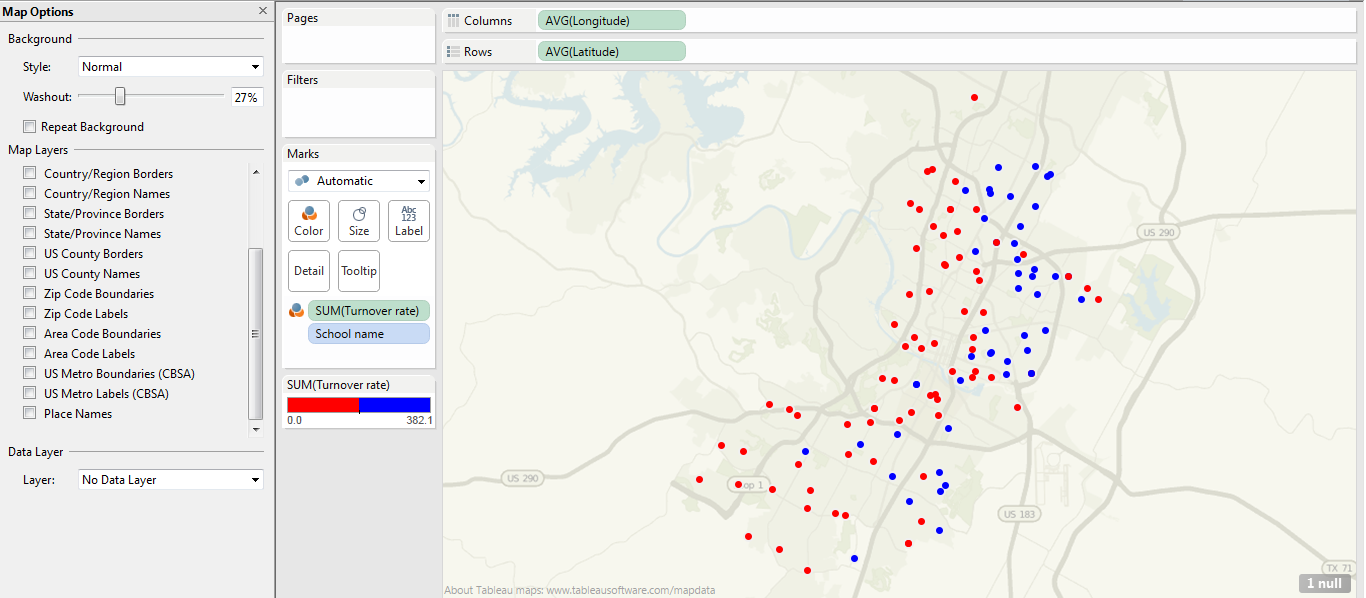
Background color options: gray, dark and normal
The default map background color is “Gray” it is typically suitable for symbol maps and filled maps. It is best to use when map layers like “zip code labels”, “place names” are displayed
The dark background is more suitable for the symbol maps.
The normal background is rarely used but it does highlight the geographical features like rivers and landscape natural.
Data source:
http://www.mystatesman.com/interactive/aisd-teacher-turnover/