Tableau fixed axis length
My use case:
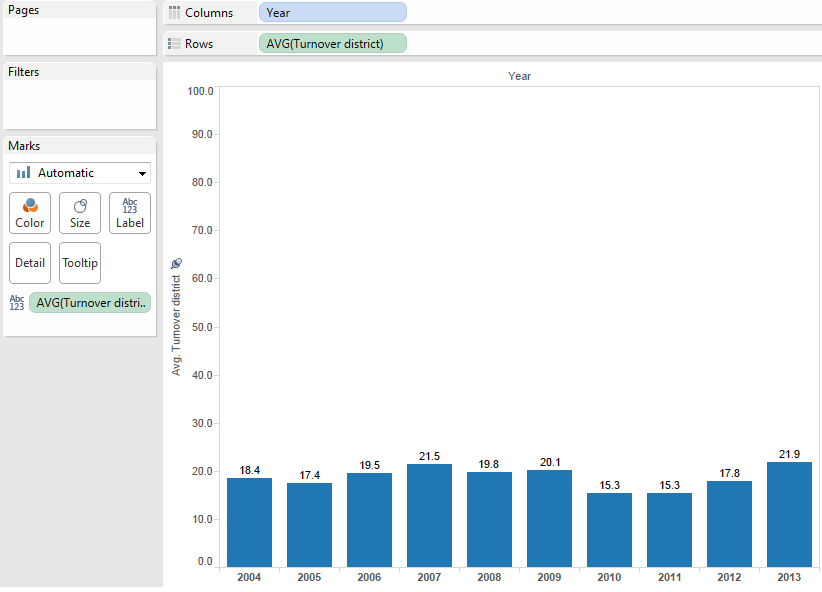
The underlying data is percentage turnover for different regions. The maximum value was around 21.
Tableau default axis length settings is automatic. It created a chart with a range of 0 – 23, but the percentage representation of the data is lost.

Before we start
The axis setting can only be modified when the column or row value is continuous and not discrete.
Steps
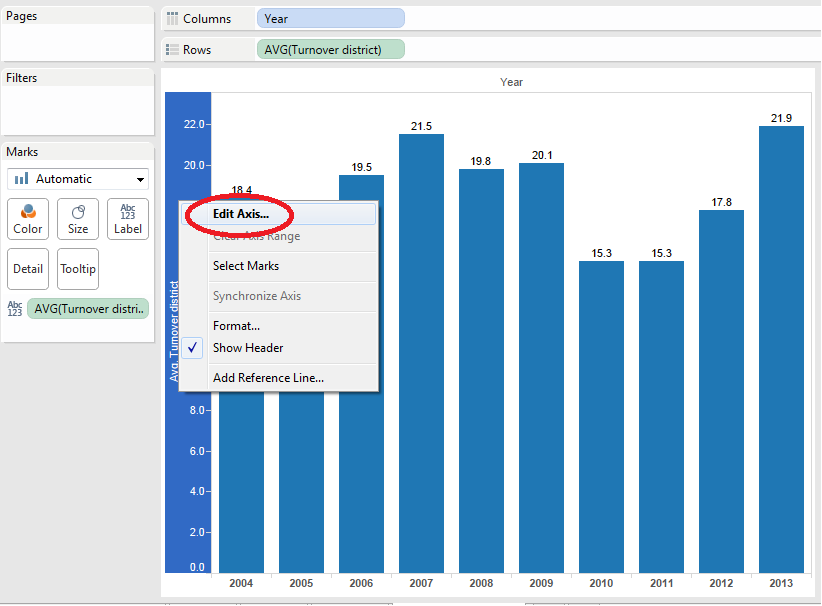
1. Right click on the axis and select “Edit Axis”
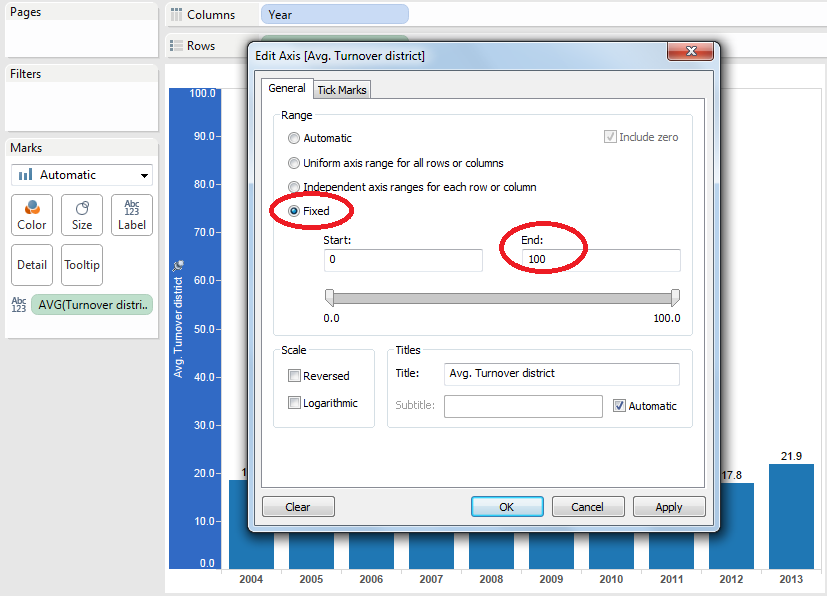
2. Change the “Fixed” range to 0 – 100
Result