Arunkumar Navaneethan Blog
Good example of using webpages dashboard object and manipulating it using URL dashboard action. (From: https://public.tableau.com/s/gallery/marvel-comic-universe) Observe the changing images in the below workbook as you Hover or select the Bar. This is an Webpage object...
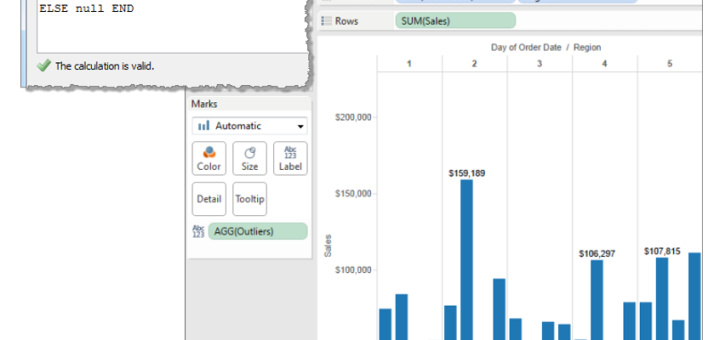
Find below conditional data labels, static and dynamic approach Conditional Data Labels (From: http://kb.tableau.com/articles/knowledgebase/conditional-data-labels) One way to display labels based on the values of fields is to drag a measure to Label on the Marks...
Check out http://www.amazon.com/Measuring-User-Experience-Interactive-Technologies/dp/0123735580 http://www.amazon.com/Quantifying-User-Experience-Practical-Statistics/dp/0123849683/
http://www.tableau.com/learn/training?qt-training_tabs=1#qt-training_tabs (Some fundamental videos) http://onlinehelp.tableau.com/current/pro/online/windows/en-us/help.htm (Tableau’s complete reference) http://community.tableau.com/welcome (the community is the best way to understand how other Tableau developers are using the application; interesting work-around) http://onlinehelp.tableau.com/current/api/js_api/en-us/help.htm#JavaScriptAPI/js_api.htm (Definitely a feature to consider when...
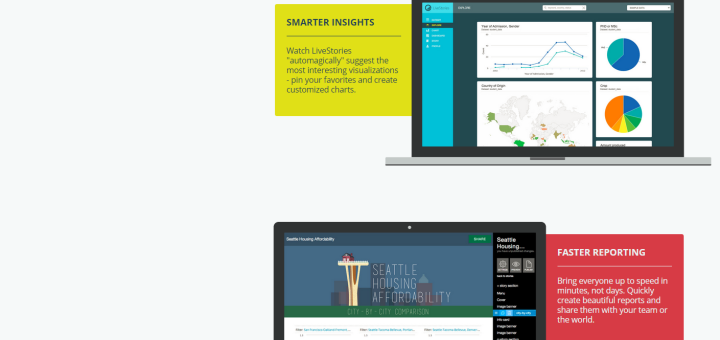
A review as of May 21th 2015 Check them out www.livestories.com An attractive tool with a simple user interface for non-technical users to analysis well structured data. The tool does have many powerful features, that...
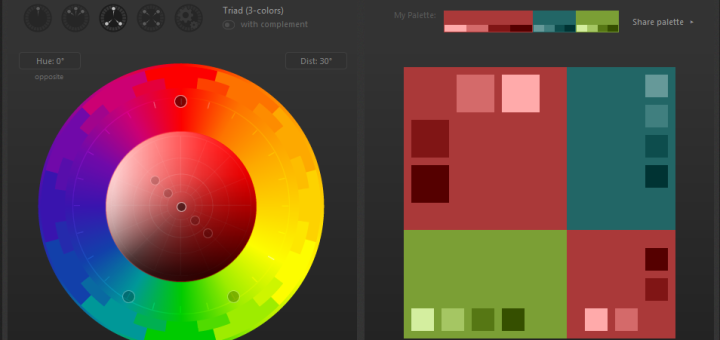
Tools for creating the color palette during dashboard design Eye Dropper for Chrome [Browser Extension] Can be used to pick RGB or HSL color codes from webpages Degraeve.com Can be used when the palette...
Below is a list of Big Data concepts to explore Hadoop Ecosystem Overview Deploying Hadoop in a physical cluster or in the cloud Best practices for cluster deployments Importing and exporting from a database with...
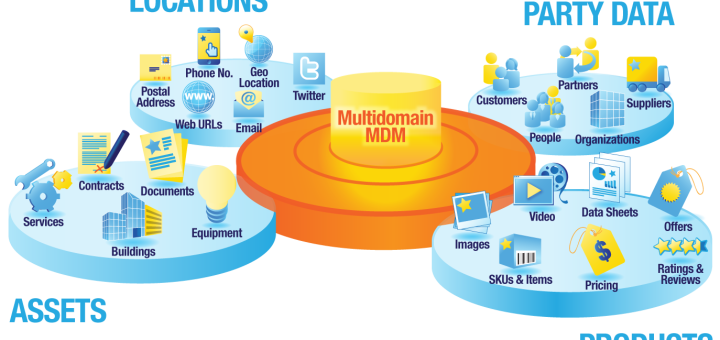
This is a well organized article on Master Data Management (MDM). The article is not tool specific, it is a good way to understand when MDM must be considered and how it can be...
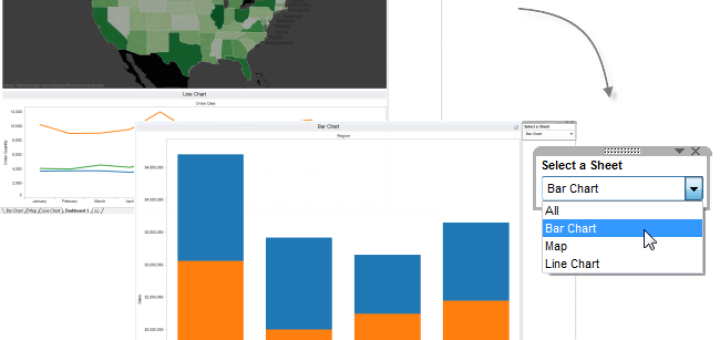
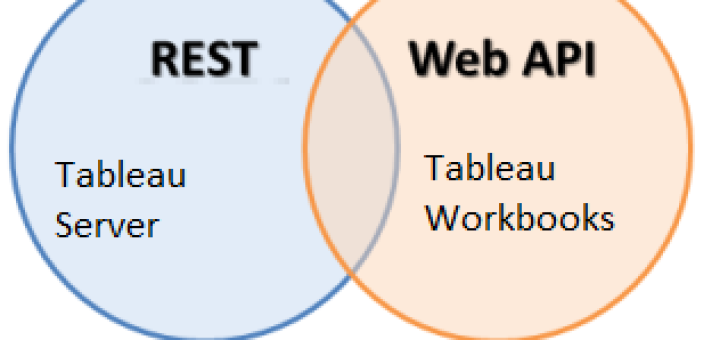
With Tableau’s JavaScript API you can integrate Tableau visualizations into your own web applications. The API lets you tightly control your users’ interactions and combine functionality that otherwise couldn’t be combined. For example, you...
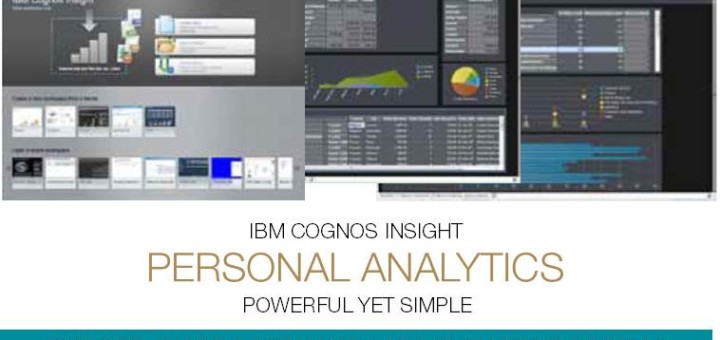
workspace data application Report Share Copy of workspace using Cognos Insight NA NA NA Publish NA Cognos TM1 Server IBM Cognos Application portal NA Publish and distribute Copy of workspace using Cognos Insight Cognos...
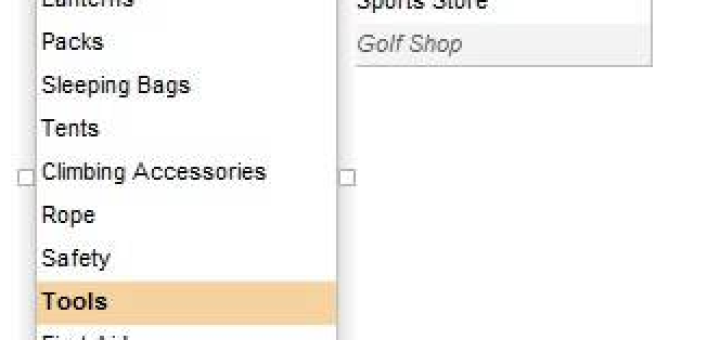
Explore points are the filters for the report Dragging and dropping a dimension or the measures list creates an explore point. The listing will be grayed out if its not in the selected values...

