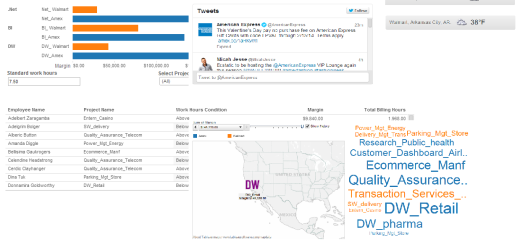
Tableau experience in Phoenix, AZ, Mar 13th 2014 – My key take away
This Tableau experience meeting gave me the opportunity to meet experts from the Tableau Company and other Business Intelligence enthusiast from Phoenix, AZ.
My key take away
- Understanding the user groups must be the first step. It is important to understand the user groups when we create data visualization. We might have to define and structure the data visuals based on the end-user.
- Data profiling acts as a major foundation. We need to profile the data we have before we start visualizing them. Follow simple profiling steps like profiling the Number of records, understanding the different measures involved.
- Ratio reflects negation data well. When ratio is used, we can understand the negation factors alongside with other measures. Ratio will be helpful to understand various correlation relationships between measures with respect to different dimensions.
- Comment the calculated field. End user can understand what is the purpose of the field and need not dive deep to see the underlying implementation.
- Bullet chart for target and actual analysis.
It was interesting to understand how Tableau differentiates itself from its competitors by offering regular upgrades to its system. It makes a lot of effort to connect to its users through multiple forums and communities. I am searching if it has a visualization making it easy to understand various communities it supports.