Tableau Pie chart on a symbol map
My Use-case
Display pie chart over every state, sized by the total number of stores. Size the slices of the pie chart by store categories. This will help us understand which states have more number of store opening and detailed by category.
Steps
1. Add the state to the chart by double clicking on state dimension or add the state dimension to details and move the longitude measure to columns and latitude measure to rows. 
2. Move the Number of store measure to the size mark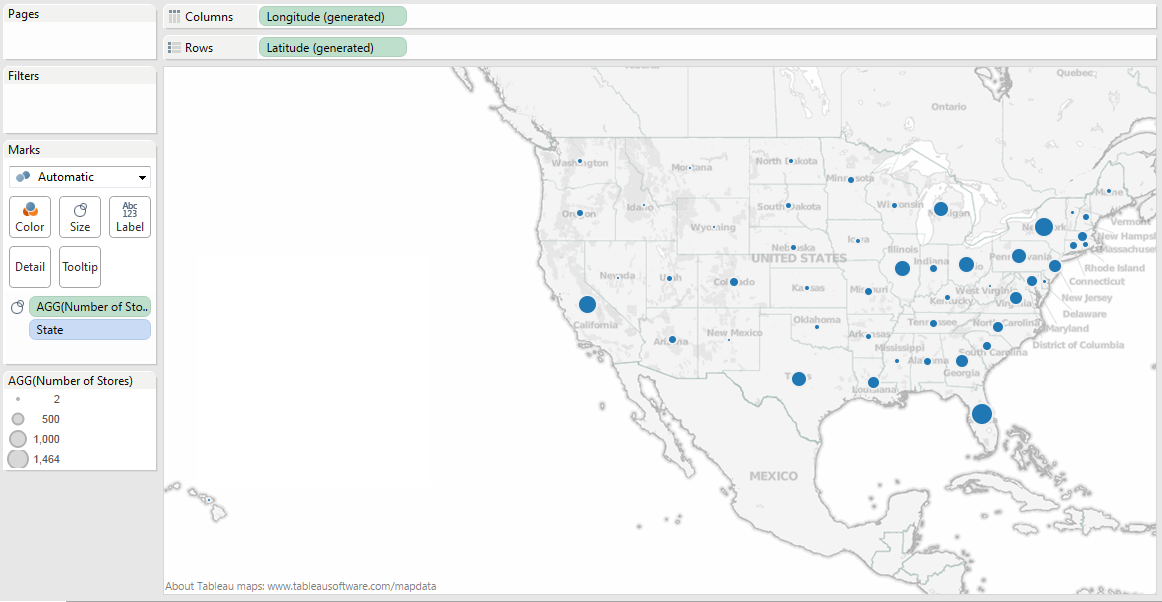
Move the Category dimension to the color mark 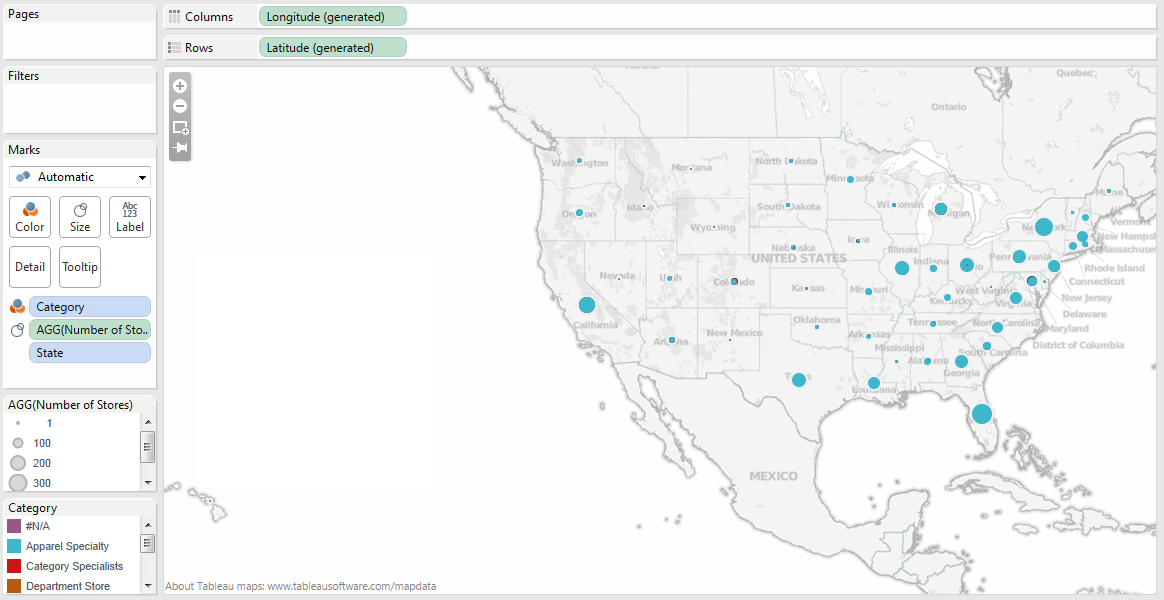
3. Change the Mark type from automatic to Pie and use the size mark to resize the pie size. The map can be zoomed into a closer view if required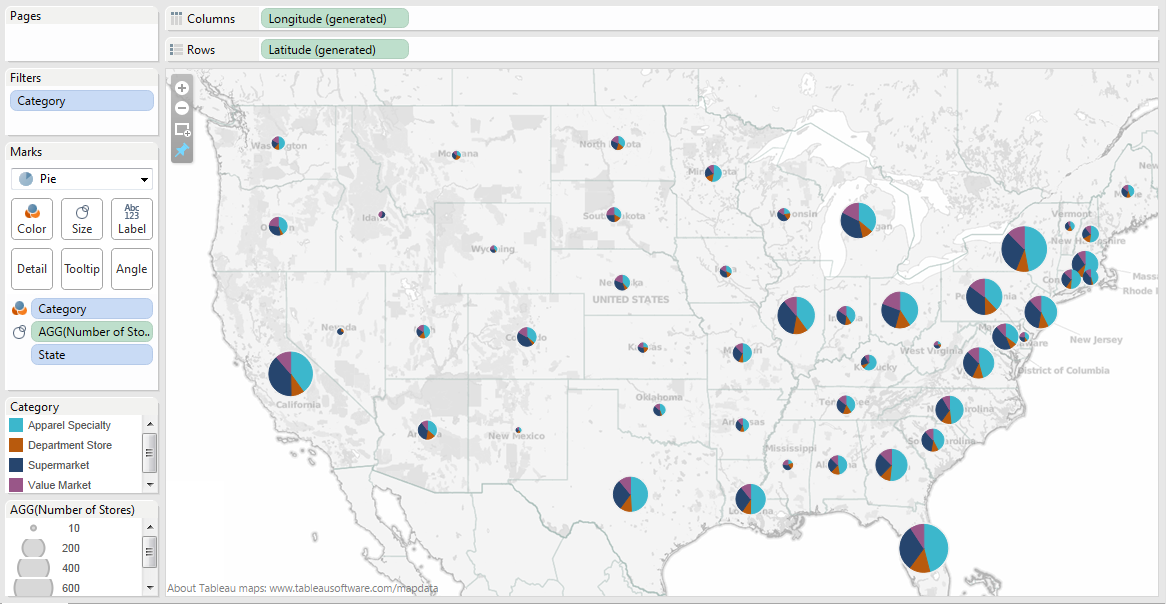
Resources
Initial tableau workbook Pie Chart (Right-click and “Save link as…”)
Original Creation
http://public.tableausoftware.com/shared/2QCDD7BPR?:display_count=no