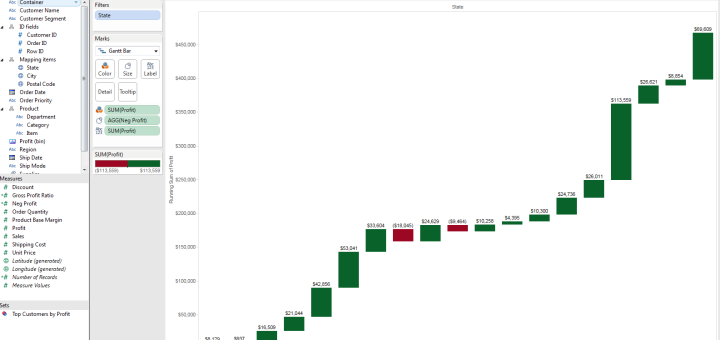
Waterfall chart in Tableau
A typical waterfall chart is used to show how an initial value is increased and decreased by a series of intermediate values, leading to a final value.
Business Information Management and Enterprise Innovation
A typical waterfall chart is used to show how an initial value is increased and decreased by a series of intermediate values, leading to a final value.
More