Author: Arunkumar Navaneethan
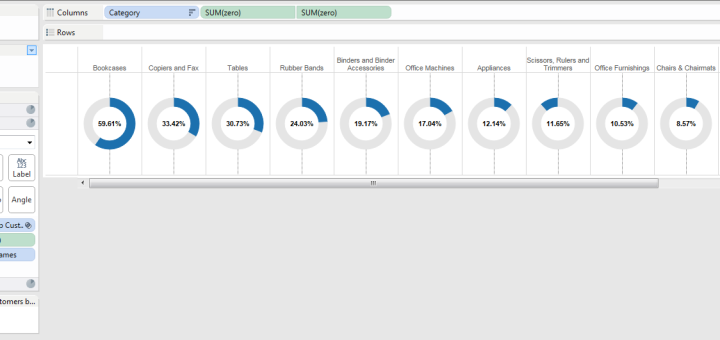
Use-case Steps for recreating the Donut chart example shared in Tableau community site. http://community.tableausoftware.com/docs/DOC-5511 A donut chart representing the percentage of top customers by profit across product categories Steps 1. Create a new Tableau...
Creating a string and number padded result SQL Server right and left padding select right(replicate(‘0’,10)+cast(25695 as varchar(15)),10) as lpad_number select left(cast(25695 as varchar(15))+replicate(‘0’,10),10) as rpad_number
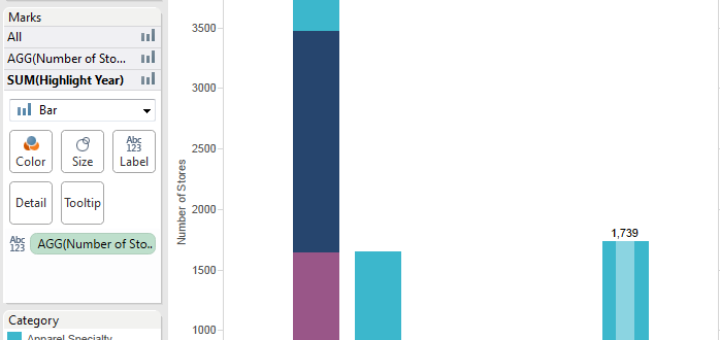
Find in link a good approach to color axis for categorical data
This will be a good approach to secure data from different users view using Tableau Server. And also a great way to provide the user with the data they will be interested in. This...
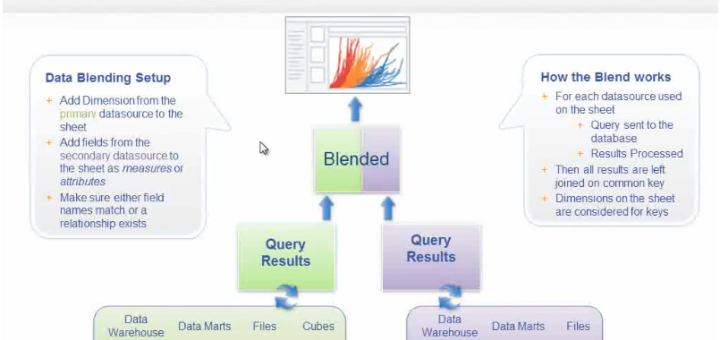
As of September 14th 2014 Tableau data blending can be used to connect to two or more different data sources which contains related information. Examples: Connecting the transaction information in Oracle DB server with...
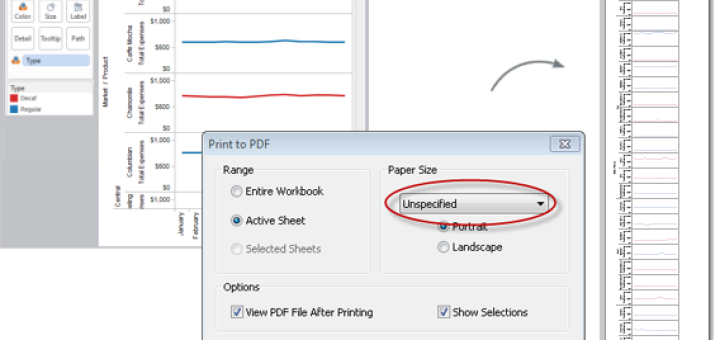
To print the entire result in a single page instead of going through multiple pages of result use In Print to PDF; Paper Size > Unspecified Pages Shelf When a print out is required...
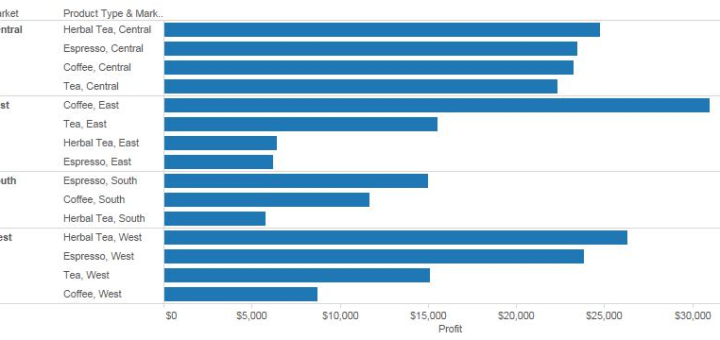
Basic sort Right click on the discrete1 field in the rows or columns shelf 1 Sort can be performed only on discrete fields or measures which is converted to discrete The discrete field can...
Interesting podcast about Technology transformation challenges related to insurance industry. Discussion about the concerns over managing the legacy systems and transforming to the latest technologies. Tier-2 and Tier-3 companies are ahead in technology transformation....
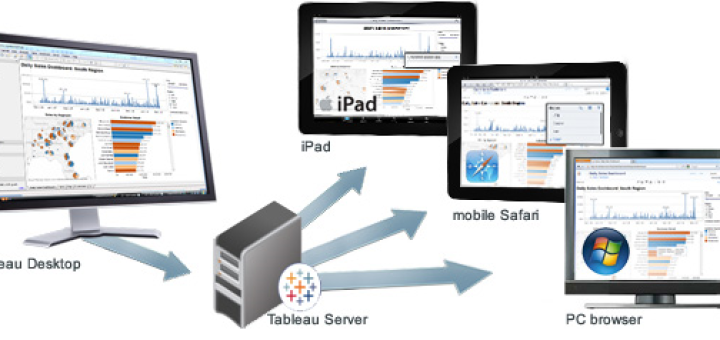
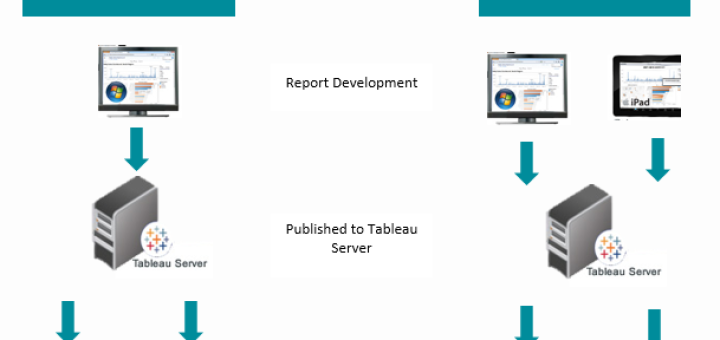
In Tableau, you do not have to do anything special to make a dashboard mobile. Simply publish to Tableau Server like you always have, and Tableau will detect if you’re using the Mobile app....
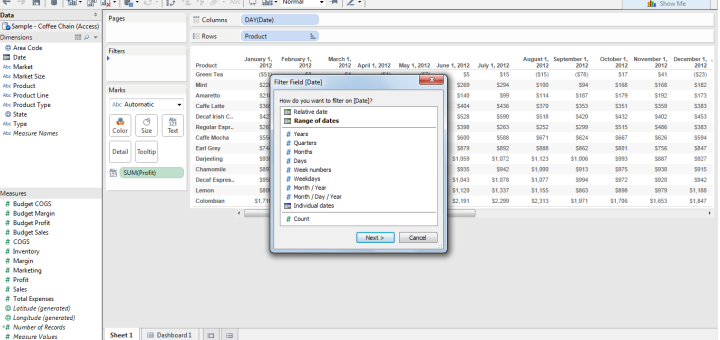
Different Date filters Relative Date – This filter helps to analysis the data with respect to year, quarter, month, weeks, days relative to the current date or an user created anchor date. Range of Dates...
