Tableau Data blending Tips and best practices
As of September 14th 2014
Tableau data blending can be used to connect to two or more different data sources which contains related information.
Examples:
Connecting the transaction information in Oracle DB server with the high level business information stored in Salesforce.
Comparing the sales in states from a transactional system with the Sales projections stored in a excel workbook
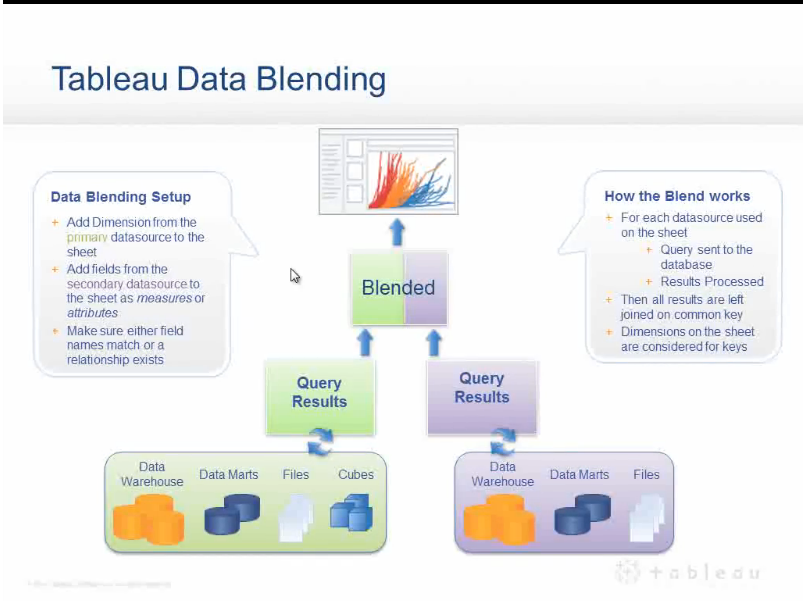
Primary data source is the data source, which we connect to when we create a new Tableau workbook(This is the default behavior, the data sources added later can also be made as the primary data source using the Primary Data source drop-down as in the below screen shot) . We can add multiple secondary workbooks to it by adding new data connections to this workbook.
Data > Connect to Data…Primary and secondary relationship can be customized by going to the Data tab
Data > Edit Relationships…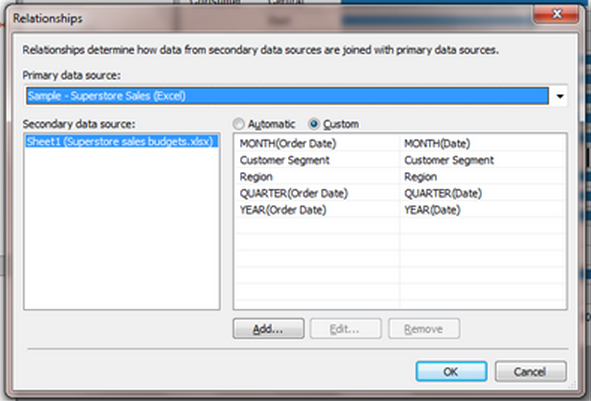
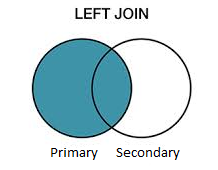
The primary to secondary data source connection is always a LEFT JOIN (if right join behavior is required then the primary to secondary data sources must be switched)
The data blending behaves well if only measures are pulled from the Secondary data source. If Dimension are required then it must be aggregated.
i.e. If a measure like $ Sales is used from the secondary data source is used a SUM will be provided, if a dimension like Region is used then it must be aggregated to MAX(Region) or MIN(Region) function or other aggregation function.
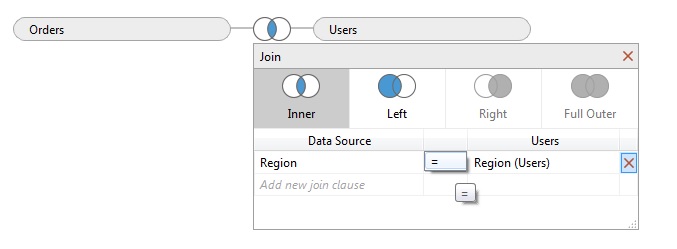
Avoid using Data blending if the data is present in the same Data source. Use the JOIN functionality provided in Tableau.


hi Arun, how are you ?
can you share your email address please.. would need your help in Tableau.
Thanks in advance for help.
Hi Naveen, you can reach me at arunkn79@gmail.com