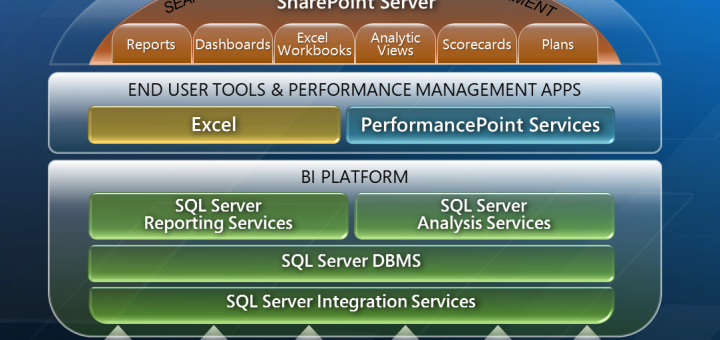
SQL Server Integration Services – Introduction
In SQL Server 2008 Business Intelligence Studio is used to create the SSIS packages (Programs). It is the client side application. In SQL Server 2012 SQL Server data tools can be used to create...
Business Information Management and Enterprise Innovation
In SQL Server 2008 Business Intelligence Studio is used to create the SSIS packages (Programs). It is the client side application. In SQL Server 2012 SQL Server data tools can be used to create...
PluralSight study plan SQL Server Business Intelligence Overview (4 Hours) SSIS Integration Services Fundamentals (7 hours) Advanced Integration Services (3.5 hours) Advanced Integration Services – Part 2 (4 hours) SSIS Design Patterns for Data Warehousing (3 hours) SSRS...
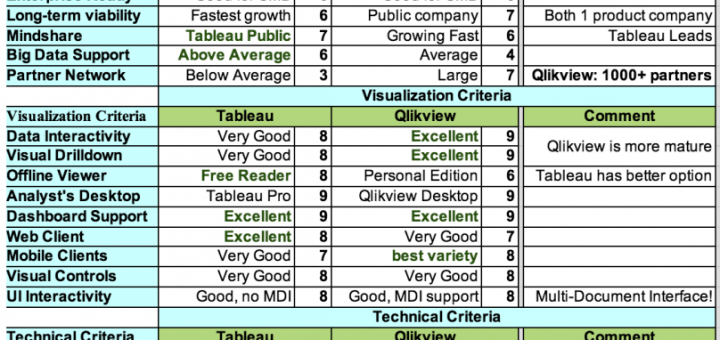
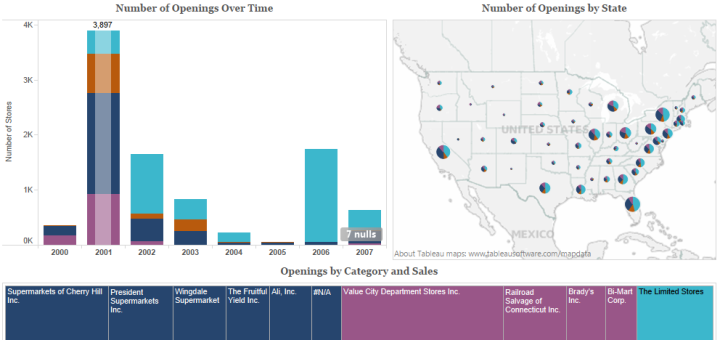
An interesting article from 2014 comparing Qlikview and Tableau. Working closely with Tableau have seen it fixing user experience issues at a very quick rate.
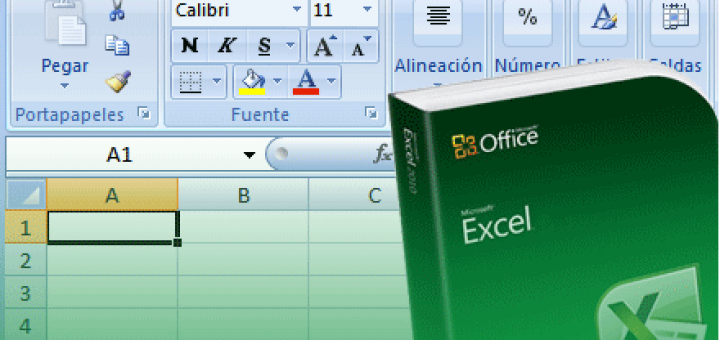
How to use a table name in data validation lists and conditional formatting formulas Link to a useful article on creating a drop-down list from table column
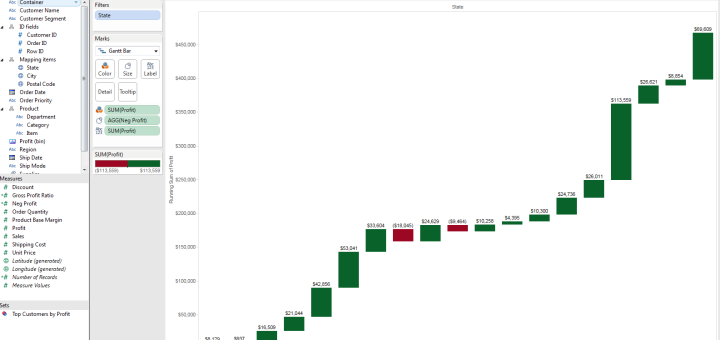
A typical waterfall chart is used to show how an initial value is increased and decreased by a series of intermediate values, leading to a final value.
Drawing with numbers site also as a good article on this http://drawingwithnumbers.artisart.org/unexpected-results-rounding/
A good article with step by step procedure to create dynamic sorting with Tableau
Good link having a consolidated list of tableau tips and tricks
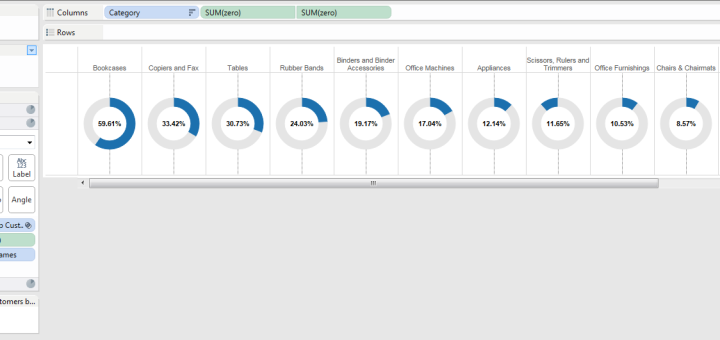
Use-case Steps for recreating the Donut chart example shared in Tableau community site. http://community.tableausoftware.com/docs/DOC-5511 A donut chart representing the percentage of top customers by profit across product categories Steps 1. Create a new Tableau...
More